ECL: How to Measure Probability of Default
Expected credit loss challenges many experienced accountants and finance people, because it contains the element of uncertainty and some sort of guessing or estimating what can happen in the future.
That’s why it is “expected” after all.
I wrote a few articles about the process of applying ECL in your accounts, so let me just sum them up shortly here for you:
- How the new impairment rules affect you
- Measuring ECL: loss rate vs. probability of default
- How to calculate bad debt provision under IFRS 9
Now, I would like to go a bit deeper into the “guess” work and shed some light into methods of measuring probability of default (PD) – perhaps the most significant and difficult to obtain component in the whole ECL calculation.
Step #1: Define the default
Before we actually get to probability of default, let’s take a look at what it is, because I see lots of misunderstanding and misconception floating around.
So, what is default?
The tricky thing is that IFRS 9 does NOT define default at all, despite the fact that default is mentioned in almost every single rule in IFRS 9 related to expected credit loss.
Cambridge Dictionary defines default as “failure to do something, such as pay debt, that you legally have to do”.
This is a very broad definition and does not tell you much about WHEN exactly that failure happens.
Luckily, IFRS 9 gives us a guidance.
In par. B5.5.37 it asks YOU (=the reporting entity) to define default in line with your internal credit risk management policies specifically for individual groups of financial instruments.
What does that mean in practice?
Illustration: Definition of default
Let’s say that a bank provides consumer loans AND invests free cash into corporate bonds.
Thus the bank has two types of financial instruments: consumer loans and corporate bonds.
Past experience of that bank shows that:
- If consumers are more than 120 days overdue with repayments of loan, then the probability of getting something repaid from them is close to zero.
- Corporate bonds held in bank’s portfolio are issued by high quality credible debtors and the bank incurred loss on these bonds only when the debtors officially announced bankruptcy.
Based on that past experience, the bank does not expect these patterns significantly change and therefore, it defines default as follows:
- For consumer loans: the default occurs when the loan payment is more than 120 days overdue.
- For corporate bonds held: the default occurs when the issuer (debtor) officially announces bankruptcy.
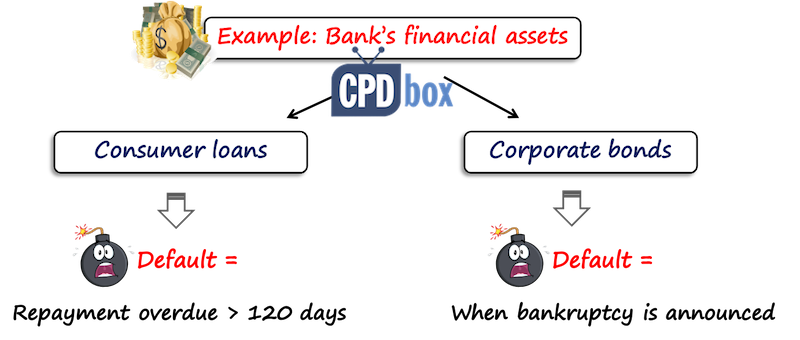
You can see here that the bank applies TWO different definitions of default for different types of assets.
And, you can come up with your own definition based on your own situation and experience.
Why is it so important to understand?
The reason why we are doing this exercise is that measuring of probability of default will depend on what the default is.
So, what are you measuring? The probability of a debtor going bankrupt? Or the probability of a debtor not paying you for more than 120 days (which does not necessarily mean that debtor went bankrupt)?
One more note related to “rebuttable presumption” in IFRS 9.
Yes, IFRS 9 says that there is a rebuttable presumption that the default does not occur later than when a financial asset is 90 days overdue.
This is just a guidance to help you and not the strict rule.
Please note the word “rebuttable” – it means that if you can somehow demonstrate that longer period than 90 days is fine and usual, then great, do not use this presumption.
Step #2: Categorize your financial assets
After you defined default, you should analyze your financial assets to see learn about their nature and individual differences.
Let’s focus on trade receivables here, but this applies to any other financial asset.
You would certainly agree with me that the “fresh” newly created trade receivable has different, much lower risk of default than the “old” receivable created and overdue more than 90 days.
Or, that the receivables to clients in Tramtaria are riskier than the receivables to clients in Beltaria, because the state of economy and purchasing power of Beltaria and their citizens are better than those of Tramtaria.
Therefore, it is not appropriate to measure ECL on all trade receivables using the same risk of default.
Instead, you should group your receivables to certain categories, or risk buckets, that share the same characteristics, that could for example be:
- Age of receivables – that is a must, you should always do that for any subcategories of financial assets;
- Geographical location – by countries, or regions, urban versus rural, etc.
- Industries – automotive, energy, travel…

You get the point – the choice of risk categories is yours. Do NOT overdo it and apply common sense in your own situation.
Step #3: Measure the probability of default
There are many methods, so let me sum the most frequent ones:
- Use of transactional history;
- Benchmarking to external entities:
- Use of ratings;
- Use of credit models;
- Use of credit default swaps.
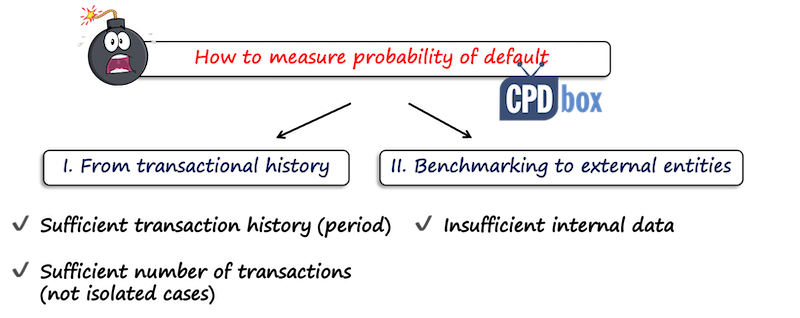
3.1 Measuring PD from your own transactional history
This method measures PD from your historic transactions by determining the likelihood of an amount not being repaid before the default point.
So, you are basically tracing the life of your receivables from their creation to their repayment, analyzing their movement between individual ageing categories and calculating average rate of default for individual ageing groups.
This method is excellent if you have a history of past transactions. You should analyze about 60 months of the life of your trade receivables portfolio to get meaningful and quite reliable results.
However, I need to warn you here, that you will get historical PD from this method.
You still need to adjust that PD for forward looking information.
On the other hand, if you do not assume any significant changes in the future based on general economic forecasts, then the use of historical PD may be accepted in some cases.
If you would like to learn step by step method with full excel illustration, we offer an online training course, so please contact us for more information.
3.2 Measuring PD by benchmarking to external entities
If you do not have a transactional history and sufficient data, you may need to compare your portfolio to external entities to measure PD.
The easiest way to do it is to use some form of external model.
Three typical examples are:
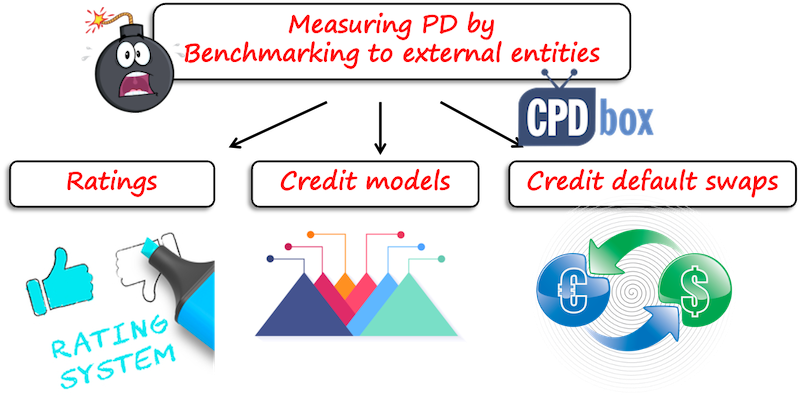
3.2.1. Use of ratings
There are three large international rating agencies: Moody’s Investor Services, S&P Global and Fitch Ratings.
These agencies assign ratings to companies and countries and then often publish the default rates per rating category. The default rates enable us to associate a rating with a PD.
Except for these three large international agencies, there are also national scale ratings applicable within certain country that you can use.
The trouble here is that you would need to set the methodology of working with these ratings and make adjustments for your own situation. However, it is doable as a benchmark.
3.2.2. Use of credit models
Besides credit rating agencies, you can find a few companies that sell models measuring credit risk.
You can access most of them via an online subscription to the service and the outcome basically depends on the specific entity:
- If you are working for a listed company, you will get a direct measurement.
- If you are in an unlisted company (like most of you perhaps are), then you may be required to input information about your entity, financial assets etc. and you will get the tailored-made measurement.
The biggest barrier to this process is cost, but there are specialist companies of ECL calculations who purchase bulk licenses for data from the rating agencies like Moody’s, and then they offer their services at very accessible price points.
What follow is my personal recommendation of one particular service, therefore I put it in the grey frame to distinguish it from the rest of the article. If you are not interested, feel free to skip that part.
My personal recommendation
I rarely recommend paid services in my articles because my goal here is to spread knowledge and educate, but this time I am making the exception. The reason is that I strongly believe this might help you.
Before I recommend the accounting measurement experts, please note that I do not have any financial reward for doing so whatsoever. I do recommend them because I believe that they can really fix your troubles with ECL at the very pleasant cost level.
The name is maela and I worked with one of the founders of this company, Mr. Laurence Milner, on my own videos about ECL. The approach and the level of their knowledge indeed outdid my expectations. Mr. Milner contributed his knowledge to this article, too.
Also, maela is a global partner of Moody’s Analytics, so your ECL calculations would incorporate inputs directly from Moody’s. As far as I know, many auditors recommend the services of this company to their clients, so I believe it’s worth to check.
How does that work?
A few simple steps:
- Click www.maela.biz, and then click “Let’s get started” button. You will be asked to fill in the simple questionnaire about your company.
- After you submit the questionnaire, wait up to 2 business days. The actual specialist, human being (not the robot!) will take a look at it and gives you the initial assessment. Actually, there’s a lot of value, too, because you will get the hint of a direction and the next steps. This assessment is completely free and will contain a quote in case you decide to complete the full process of your ECL calculation with maela. That’s your choice though. You can decide to keep the assessment and not to proceed with maela.
- After you accept the offer, you will get the access to maela’s online system. You will submit your data about receivables or other financial assets as required. If you are stuck, no problem, another kind human being will help you.
- maela does the measurement and calculations.
- You get the expert report containing the calculation of your ECL provision with all the data. You can use this report for your auditors.
Now, maela agreed to offer 15% discount up to 1 000 EUR to all subscribers to the IFRS Kit. That might cover even the biggest and complex calculations.
Please see the short demo video here:
I must say here that yes, you can construct a credit model yourself, but that’s very challenging, because this process requires strong mathematical and financial knowledge, selection of the right input information while considering any potential effects and specifics of your situation.
However, the choice is fully up to you.
3.2.3. Use of credit default swaps
If you work for a listed company, you might consider using a credit default swaps (CDS).
The price of the CPDs represents an objective measurement of the risk of default and thus you can easily use it.
How?
You would compare the price of CDS of an asset under evaluation to other CDS prices and identify an entity that has a similar price AND is rated.
There is an active CDS market for sovereign bonds so you should be able to find a sovereign bond with a similar CDS price.
I am mentioning this method because it is used for some types of financial assets, like bonds, but not so much for trade receivables.
Final words…
I tried to outline a few possibilities or option for you to measure probability of default, the most important component of many ECL calculations.
There are many other ways of doing so: for example, you can assess the rating judgmentally by benchmarking to similar entities and adjusting for the differences.
If you are interest in learning more about ECL and getting the clear picture of its calculation, please contact me and I’ll send you the information about our new online course.
Please share this article with your friends and leave a comment below if you have a question or note. Thank you!
JOIN OUR FREE NEWSLETTER AND GET
report "Top 7 IFRS Mistakes" + free IFRS mini-course
Please check your inbox to confirm your subscription.
23 Comments
Leave a Reply


Please write an article covering reporting implications of complex conditional benefit arrangements with employees including tri-party contracts such as bank and employee for the house loan. This should cover necessary adjustments over the contract period, presentation of assets, liability and contingent liability in the books of the employer. Different arrangements for revenue from selling to employees can be covered too.
Thank you
Dear Silvia
Thanks for sharing your thought on how to measure probability of Defalut. was helpful fore me. Please also share your simple steps to measure loss given default in the Banking context.
Best
Dear Mrs Silvia
why we use 5 years historical loan data when we do PD in ECL computation?
That would be ideal if you can use at least 5 years, but you should consider other factors – e.g. you cannot compare years 2018 and 2019 with 2020 and 2021 due to pandemic effect on some businesses. So you should really think hard what period to use that would be the most representative sample to discover the patterns of your own receivables.
Hey, my question is more related to practical implementation issues faced
1) The bucketing intervals of ageing were not consistent like the first bucket was of 0-30 days, the second bucket was of 31-90 days, 91-180, 180-360 then 360 to 720. What to do in such a scenario. can we use such buckets for flow rate calculation.
2) Rebuttable presumption of 90 days is it relevant under simplified approach?
3) LGD calculation is made from the same receivables data used in PD which has already taken the recoveries impact in flow rate. LGD has to be calculated in a performance window from recoveries of actual defaults. The calculation should be on data after an account has defaulted and it should include the legal and other costs as well. Is it necessary to consider all this under a simplified approach?
4) The historical information of GDP shall be used with economic cycles in history to forecast one in future. Only 5 years of history is not enough. under simplified approach is it essential to consider economic cycles in history?
Hi Silvia
That is me Magdeldin , one of your CPD box and IFRS kit students and learners, I have had a chat once past time , one is about VAT in Saudi Arabia, the other was about preparing a CPD box in IFRS for SMEs and now I am asking an other one for IPSAS for it it’s increasingly importance her in Saudi Arabia , particularly after the mandatory transformation from cash basis to accrual basis for all Governmental and semi-Governmental , and Non-for profit institutions.
Further more and related to our topic, please send me the excel calculating the PD and CPDs, and all in all what is the interpretation and decision that we have to make about our credit receivables, in other words would that help in collection or factoring of receivables , or what was the rationale and objective of calculating the whole story
Thanks in advance for your great help and value creation for the whole industry
Thank you very much for your hard work, please continue your effort …….
Hi Silvia,
Thank you so much for the feedback and well explained.
Regards,
Hello Silvia,
Kindly assist with an excel example using the transaction history method to ***email hidden***.
1. For clarity are we saying here that we extract information from our receivables ledger over a period of 5years?
2. The start comparing Invoicing date Vs receipt date to come up with the average default rate?
3. If point two above is the case ,what assumptions do we use to roll forward the PD rate above, it been looking forward?
Regards,
Kelvin
Hi Kelvin,
thank you for your message. Yes, you should analyze your receivables for over a period of 60 months in average. You would rather compare how much was not paid from the group originated at the certain date (or how much entered into default). Thus you would get your own historical PD, which should be adjusted for forward-looking info. And n.3 – you need to work with external data, because that’s certainly not derived from your transactional history, unless you can reliably predict the future (auditors would certainly question it). Having that said, I am almost certain that if you want to get it right, you will incur some costs to purchase the forward-looking data. Maybe your local government agencies publish something, then it is a question of selecting the right parameters/factors affecting your business. As I have said, there’s no right or wrong answer. If you really want to ease your life, then just pay a few hundred dollars and let experts do the calculations (e.g. my recommendation above, or any other company).
Hi Silva,
You are doing great job and your content is really helpful and also provide an opportunity to understand the concept from different angel. Whenever i read you content is feel that i must restudy the topic again.
Thanks a lot for you initiative. Keep it up.
Thank you 🙂
Thanks Silvia
Dear Selvia
Every Time you mak it Easy and enjoyable every time you make me Love more
Thank you …. my teacher
God bless you
Thank you, it means a lot to me! 🙂
Hi there,
Thank for your lecture, though I would to have more expertise on ECL, thus if you may be kind enough to send me more links for study.
Look forward to hearing from you at your earliest convenience.
Kindest regards
Olivier
Hi Olivier, I will send you the email with info on our new course.
Thank you for your efforts.
we need an example in excel sheet to understand the story.
Thanks
what is the suitable tool of the following to calculate the PD?
• Roll Rate.
• Markov chain
• Vintage analysis.
All three of them work, there is not one method suitable in all situations. The problem is that most people think it is black or white; that one solution fits everyone. Not true in this case, because there are many choices and you need to have some credit expertise to do so. I am trying to educate accountants here about the options and choices.
Silvia Every time I read your article i become more sure that you really know what am looking for and when i am traying to translate it into Arabic I feel that you do something GRAT – i dont have anything to say just you are the who make me know More – I hope Good Help you thank you my teacher
I do not have term for your contribution.
Thank you 🙂